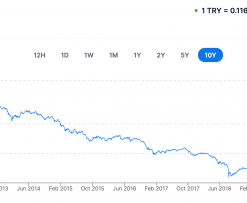
Economagic.com: Economic Time Series Page
 Browse Data Titles  |  Books  |  Charts  |  Excel  |  Reports  |  Search  |  Maps & Movies  |  Help  |  About  |  Contact Us
 Subscriber Login  |  Subscription Info  |  Turn Advanced Features On  |  Change Defaults  |  Disclaimer

Learn how to create Excel dashboards.

 Series Title: Gross domestic product: Real Gross Domestic Product, Chained Dollars: Billions of chained 2000 dollars; SAAR (quarterly)
   For this series:   Numerical Data  |  Forecast  |  GIF Chart  |  PDF Chart  |  Excel file  |  Self-updating Excel file
   Transform this series  |  Display series in COPY/PASTE format  |  Reverse this series  |  Data set page

 1947 01  361570·5          Link to Series in Level 2 Subscription Site
 1947 02  141568.7          Link to Series in Level 1 Subscription Site
 1947 03  951568·0          Link to Series in Level 0 Subscription Site
 1947 04  991590·9
 1948 01 741616.1
 1948 02 651644·6
 1948 03 231654.1
 1948 04 281658·0
 1949 01  401633.2
 1949 02  771628.4
 1949 03  161646.7
 1949 04  191629.9
 1950 01 861696·8
 1950 02 321747·3
 1950 03 841815.8
 1950 04 151848.9
 1951 01  871871.3
 1951 02  361903.1
 1951 03  671941·1
 1951 04  851944.4
 1952 01 431964·7
 1952 02 211966·0
 1952 03 271978·8
 1952 04 232043·8
 1953 01  792082.3
 1953 02  432098.1
 1953 03  522085·4
 1953 04  502052·5
 1954 01 452042·4
 1954 02 852044.3
 1954 03 542066.9
 1954 04 82107.8
 1955 01  182168·5
 1955 02  522204·0
 1955 03  732233.4
 1955 04  682245.3
 1956 01 982234·8
 1956 02 772252·5
 1956 03 702249·8
 1956 04 222286.5
 1957 01  92300·3
 1957 02  162294.6
 1957 03  332317.0
 1957 04  912292·5
 1958 01 32230·2
 1958 02 502243·4
 1958 03 762295.2
 1958 04 182348.0
 1959 01  552392·9
 1959 02  872455.8
 1959 03  372453.9
 1959 04  732462·6
 1960 01 652517.4
 1960 02 582504.8
 1960 03 772508.7
 1960 04 492476·2
 1961 01  582491.2
 1961 02  202538·0
 1961 03  862579.1
 1961 04  672631·8
 1962 01 852679.1
 1962 02 542708.4
 1962 03 762733.3
 1962 04 692740·0
 1963 01  222775.9
 1963 02  672810.6
 1963 03  842863·5
 1963 04  252885·8
 1964 01 682950·5
 1964 02 912984·8
 1964 03 743025.5
Sites of Interest: Professional Services Automation · Printers · Debt Consolidation · Electricity Prices · Texas Electric Service · Texas Electricity Rates · Texas Electricity · Tattoos · Business Software Downloads · Furniture · Web Analytics · Franchise Opportunities · Drug Addiction Treatment Centers · Free Games · Diet · Geek Blog · Free Games · Fernstudium und Weiterbildung· Casino Bonus·

 1964 04 393033·6
 1965 01  373108.2
 1965 02  503150.2
 1965 03  523214·1
 1965 04  883291·8
 1966 01 383372.3
 1966 02 73384.0
 1966 03 353406·3
 1966 04 423433.7
 1967 01  873464·1
 1967 02  623464.3
 1967 03  13491·8
 1967 04  213518.2
 1968 01 883590.7
 1968 02 23651.6
 1968 03 173676.5
 1968 04 743692·0
 1969 01  683750.2
 1969 02  363760·9
 1969 03  753784·2
 1969 04  733766·3
 1970 01 813760.0
 1970 02 993767.1
 1970 03 893800·5
 1970 04 153759.8
 1971 01  73864.1
 1971 02  513885.9
 1971 03  13916·7
 1971 04  223927·9
 1972 01 473997·7
 1972 02 754092.1
 1972 03 784131.1
 1972 04 414198.7
 1973 01  324305.3
 1973 02  834355.1
 1973 03  94331·9
 1973 04  464373.3
 1974 01 144335·4
 1974 02 94347·9
 1974 03 114305.8
 1974 04 334288·9
 1975 01  724237.6
 1975 02  124268.6
 1975 03  264340.9
 1975 04  244397.8
 1976 01 104496.8
 1976 02 774530·3
 1976 03 194552.0
 1976 04 664584.6
 1977 01  564640.0
 1977 02  154731·1
 1977 03  814815.8
 1977 04  334815·3
 1978 01 634830·8
 1978 02 605021·2
 1978 03 285070·7
 1978 04 215137.4
 1979 01  105147.4
 1979 02  715152.3
 1979 03  15189·4
 1979 04  525204.7
 1980 01 05221.3
 1980 02 345115.9
 1980 03 665107.4
 1980 04 745202·1
 1981 01  635307·5
 1981 02  585266·1
 1981 03  145329.8
 1981 04  585263.4
 1982 01 515177·1
 1982 02 785204.9
 1982 03 625185·2
 1982 04 45189.8
 1983 01  445253·8
 1983 02  545372·3
 1983 03  505478·4
 1983 04  315590.5
 1984 01 445699·8
 1984 02 705797·9
 1984 03 445854.3
 1984 04 895902.4
 1985 01  805956.9
 1985 02  376007.8
 1985 03  366101.7
 1985 04  486148.6
 1986 01 56207.4
 1986 02 886232.0
 1986 03 406291.7
 1986 04 76323·4
 1987 01  996365.0
 1987 02  856435.0
 1987 03  996493.4
 1987 04  876606.8
 1988 01 656639.1
 1988 02 116723.5
 1988 03 786759·4
 1988 04 366848.6
 1989 01  306918·1
 1989 02  766963.5
 1989 03  697013.1
 1989 04  267030.9
 1990 01 507112.1
 1990 02 157130.3
 1990 03 877130.8
 1990 04 557076·9
 1991 01  17040.8
 1991 02  897086·5
 1991 03  737120·7
 1991 04  447154·1
 1992 01 897228·2
 1992 02 807297.9
 1992 03 937369·5
 1992 04 417450.7
 1993 01  407459·7
 1993 02  17497·5
 1993 03  397536·0
 1993 04  187637·4
 1994 01 97715·1
 1994 02 847815·7
 1994 03 277859·5
 1994 04 737951.6
 1995 01  757973.7
 1995 02  917988.0
 1995 03  968053.1
 1995 04  278112·0
 1996 01 408169·2
 1996 02 58303.1
 1996 03 148372·7
 1996 04 288470·6
 1997 01  348536·1
 1997 02  368665.8
 1997 03  728773.7
 1997 04  498838·4
 1998 01 98936.2
 1998 02 208995.3
 1998 03 859098·9
 1998 04 869237.1
 1999 01  459315·5
 1999 02  169392·6
 1999 03  959502.2
 1999 04  629671.1
 2000 01 459695.6
 2000 02 89847.9
 2000 03 669836.6
 2000 04 239887·7
 2001 01  379875·6
 2001 02  79905.9
 2001 03  929871·1
 2001 04  439910.0
 2002 01 759977.3
 2002 02 4810031.6
 2002 03 8710090·7
 2002 04 1910095.8
 2003 01  3710126·0
 2003 02  8910212.7
 2003 03  9210398.7
 2003 04  7210467.0
 2004 01 2710543.6
 2004 02 1610634.2
 2004 03 7410728·7
 2004 04 5110796·4
 2005 01  7410875·8
 2005 02  3910946.1
 2005 03  2411050.0
 2005 04  2711086.1
 2006 01 3111217·3
 2006 02 9211291·7
 2006 03 5711314·1
 2006 04 9711356·4
 2007 01  7611357·8
 2007 02  3611491.4
 2007 03  1511625·7
 2007 04  8511620.7
 2008 01 1311646·0
 2008 02 5411727.4
 2008 03 6311712.4
 2008 04 3611522·1
 2009 01  7011360.5

 Series Title: Gross domestic product: Real Gross Domestic Product, Chained Dollars: Billions of chained 2000 dollars; SAAR (quarterly)
   For this series:   Numerical Data  |  Forecast  |  GIF Chart  |  PDF Chart  |  Excel file  |  Self-updating Excel file
   Transform this series  |  Display series in COPY/PASTE format  |  More series like this one

Want Personal Workspace access from any computer?

Sites of Interest: Professional Services Automation · Printers · Debt Consolidation · Electricity Prices · Texas Electric Service · Texas Electricity Rates · Texas Electricity · Tattoos · Business Software Downloads · Furniture · Web Analytics · Franchise Opportunities · Drug Addiction Treatment Centers · Free Games · Diet · Geek Blog · Free Games · Fernstudium und Weiterbildung· Casino Bonus·

 Subscriber Login  |  Subscription Info  |  Turn Advanced Features On  |  Change Defaults  |  Disclaimer
 Browse Data Titles  |  Books  |  Charts  |  Excel  |  Reports  |  Search  |  Maps & Movies  |  Help  |  About  |  Contact Us
 Economagic.com: Economic Time Series Page
 US Macro 1  |  US Macro 2  |  Japan  |  Europe  |  Australia
 GDP by category  |  Gross State Product  |  Personal Income
 Interest Rates  |  House Construction  |  House Sales  |  Building Permits  |  Construction Put in Place    Trucking Jobs    Owner Operator Jobs
 Price and Cost Indices:  Consumer  |  Producer  |  Employment Cost
 Retail Sales  |  Industrial Production, Capacity & Utilization  |  Electric Power Use
 Labor Force:  US by categories  |  by State  |  by MSA (City)
 Nonfarm Employment by categories:  US  |  by State and City
 Stock Price Indexes  |  Bridge/CRB Spot Indices  |  LIBOR